

The worst part of a broken measurement pipeline isn't the broken number. It's the meeting where a client asks why last month's ROAS was 4.1 in the QBR deck but 3.6 in the live dashboard, and nobody on your side can answer without opening five tabs and a Slack thread. That silence costs more trust than a bad performance month ever will. Clients forgive underperformance. They don't forgive numbers they can't rely on.
Most agencies don't have a measurement platform architecture. They have accumulation. A connector here, a Google Sheet there, a Looker Studio dashboard someone built in 2022 that still runs the whole reporting layer because nobody remembers how it works. It functions until an API changes, a naming convention drifts, or a new client with three ad accounts and a weird CRM shows up — and then the whole thing quietly starts lying.
This piece is about the plumbing. Not dashboards, not attribution philosophy — the actual movement of data from source to report, and where you put controls so that when something breaks, it breaks loudly and early instead of silently in front of a client.
Where the pipeline actually leaks
If you trace a typical agency data flow end to end, failures cluster in predictable spots. Understanding the clusters matters more than memorizing fixes, because the same failure shows up in a dozen disguises.
Ingestion drift. A platform renames a field, deprecates a metric, or changes how it reports conversions in the API versus the UI. Your connector keeps pulling, but now conversions includes view-through where it didn't before. Nothing errors. The number just shifts.
Silent partial loads. A sync times out at 80% and reports success. You've got Monday through Thursday of spend but Friday and Saturday are missing. The row count looks plausible. Nobody checks.
Transformation assumptions. Someone hardcoded that "purchase" is the primary conversion event. A new client uses "checkout_complete." The pipeline runs clean, produces a dashboard, and every efficiency metric for that client is wrong by whatever the gap is between the two events.
Semantic collisions. One team defines "leads" as form fills. Another counts qualified leads from the CRM. Both call it "leads" in their client's report. When leadership tries to roll up agency-wide performance, the two definitions get summed and the aggregate is meaningless.
The pattern underneath all of these: the pipeline optimizes for "did it run" instead of "is it right." A job that completes gets treated as a job that succeeded. That gap is where client trust goes to die.
The layers, and why separating them is the whole game
A measurement architecture that holds up under scale has clear seams between stages. When everything is mashed into one Looker Studio file pulling directly from connectors, you can't test anything, you can't trace anything, and you can't change one thing without risking everything downstream.
Eliminate marketing chaos with streamlined campaign control.
Digmaly lets you plan, execute, and track every campaign effortlessly.
- Unified campaign management
- Real-time client reporting
- Collaborative team workflows
No credit card required
Here's the separation that actually works in an agency context:
| Layer | Job | What lives here | What must NOT live here |
|---|---|---|---|
| Raw / landing | Store source data untouched | Exact API responses, timestamped, append-only | Any business logic or renaming |
| Staging | Standardize structure | Type casting, deduping, consistent column names | Metric definitions, joins across sources |
| Transformation | Apply business logic | Joins, currency normalization, conversion mapping | Client-specific dashboard hacks |
| Semantic layer | Define metrics once | "ROAS," "CPL," "qualified lead" — single definitions | Ad-hoc formula overrides |
| Reporting | Present | Dashboards, exports, narratives | Any calculation not defined upstream |
The rule that saves you: a metric is defined exactly once, in the semantic layer, and every report inherits it. The moment someone recalculates ROAS inside a dashboard because "it was easier," you've forked your truth. Now you have two ROAS definitions and no way to know which client is seeing which.
The raw layer being append-only and untouched is the other non-negotiable. When a client disputes a number, you need to replay exactly what the platform returned on the day the number was generated. If your pipeline overwrites raw data on every sync, you can't do forensics. You're just guessing.
Operational reporting and strategic reporting are not the same system
This is the split most agencies never make, and it causes constant friction. Trying to serve two completely different needs from one reporting layer makes both worse.
Operational reporting is for the people running accounts, daily. It needs to be fast, granular, and tolerant of noise. A media buyer checking pacing at 9am doesn't care that yesterday's data is still settling — they need directional signal now. If a number is 5% off because attribution is still baking, that's fine. They're making budget shifts, not defending quarterly claims.
Strategic reporting is for QBRs, client leadership, and decisions about budget reallocation across channels. It needs to be stable, reconciled, and defensible. It should update on a slower cadence — settled data only, locked after a reconciliation window.
When you serve both from the same tables, one of two bad things happens. Either your strategic reports inherit the noise of operational data and a client watches a number change between when they screenshot it and when they present it internally. Or you slow down operational data to match strategic stability, and your buyers are working off stale numbers and missing intervention windows.
A typical scenario: an agency runs a single "performance" dataset. The media buyer catches a CPA spike at 10am and pauses a campaign. The account lead pulls the same dataset for a client email at 4pm, after the platform backfilled conversions, and the spike is gone. Now the client is confused about why a campaign got paused over a problem that "doesn't exist." Two different jobs, one dataset, guaranteed miscommunication.
Separate them. Operational tables refresh often and carry a "provisional" flag. Strategic tables refresh on a reconciliation schedule and only pull data past the settling window. This also cleanly connects to how you decide between measurement approaches in the first place — if you're leaning on modeled attribution or holdouts, the media-mix decision framework for agencies matters more at the strategic layer, where stability is the whole point, than at the operational layer where you just need to move fast.
Governance gates: where the pipeline is allowed to stop itself
Governance in a measurement platform isn't a policy document. It's a set of gates in the actual data flow that refuse to promote bad data to the next layer. This is the single biggest upgrade most agencies can make, and it's mostly unglamorous.
A gate is a check that runs between layers and either passes data forward or halts and alerts. Think of it as a bouncer at each seam in the architecture.
Practical gates worth building, roughly in order of impact:
-
Freshness gate No source is more than X hours stale. If Meta data is 30 hours old, halt promotion to strategic reporting and flag it. Prevents the "we reported on incomplete data" disaster.
-
Row-count sanity gate Today's row count should be within a reasonable band of the trailing 14-day average. A campaign account that suddenly returns 40% fewer rows didn't get 40% more efficient — something broke.
-
Spend reconciliation gate Total spend in your pipeline should match the platform UI within a tight tolerance (say 1–2%). Larger gaps halt and alert.
-
Null-explosion gate If a key dimension (campaign name, conversion type) suddenly has a spike in nulls, something changed in the source schema.
-
Definition-lock gate Any change to a semantic-layer metric definition requires explicit sign-off before it deploys. No silent formula edits.
The mistake agencies make with governance is treating it as a one-time audit rather than a running system. A quarterly data review finds problems weeks after they've already contaminated client reports. Gates catch them at the seam, before promotion. The governance mindset here overlaps heavily with the access and credential discipline covered in agency data governance for ad ops — who's allowed to change a metric definition is as much a governance question as who's allowed to touch a connector's credentials.
Lineage: knowing what feeds what before you need to
Lineage is the map of dependencies — this dashboard number comes from this semantic metric, which comes from this transformation, which joins these three staging tables, which come from these two connectors. Most agencies have this map entirely in one senior person's head. When that person is on vacation and a client dispute lands, the whole team is blind.
You need lineage for two moments specifically.
The first is impact analysis before a change. A platform deprecates an API endpoint. Which downstream reports break? Without lineage, you find out when clients email you. With lineage, you query the dependency graph in a few minutes and know exactly which clients are affected — and can get ahead of it.
The second is root-cause tracing after a discrepancy. A number looks wrong. Lineage lets you walk backward — reporting to semantic to transformation to raw — and find the exact stage where the value diverges from expectation. Without it, you're checking every layer manually while the client waits.
A workable lineage practice doesn't require expensive tooling to start. At minimum, maintain a dependency registry: every metric maps to its transformation, every transformation lists its input tables, every table lists its source connector. Even a well-maintained document beats tribal knowledge.
Start lineage as a simple dependency registry (a spreadsheet or document) that maps metrics → transformations → input tables → connectors so you can answer impact questions quickly.
Past 15–20 clients, this stops being optional, because the number of dependency chains grows faster than any one person can track.
CI-style testing: treat your pipeline like the software it is
The shift that separates agencies whose reporting is trustworthy from agencies who are one API change away from an embarrassing QBR: they test their data pipeline the way engineers test code. Every change runs through automated checks before it touches production reporting.
You don't need a full engineering org for this. You need a set of assertions that run automatically on a schedule and on every change.
A practical set of tests, in the order you'd build them:
-
Schema tests. Assert that every source table has the expected columns with the expected types. When Meta adds or renames a field, this catches it before it silently corrupts a join.
-
Uniqueness tests. Assert that primary keys are actually unique. A duplicated campaign-day row is the most common cause of inflated spend numbers.
-
Not-null tests. Assert that critical fields are never null. Catches partial loads and mapping failures.
-
Referential tests. Assert that every conversion event maps to a known event type. Catches the "new client uses a new event name" failure before it produces a wrong efficiency metric.
-
Range tests. Assert that ROAS, CPC, and CPA fall within sane bounds. A CPA of $0.03 or $30,000 is almost always a data bug, not a performance event.
-
Reconciliation tests. Assert pipeline totals match source totals within tolerance.
The point of running these on every change is the same reason software teams do it: you catch the break in a staging environment, not in front of the client. When a junior analyst updates a transformation and accidentally double-counts a join, the uniqueness test fails, the change never promotes, and nobody outside the team ever sees it.
When this level of rigor actually makes sense
Not every agency needs all of this on day one. Running three clients on two platforms, a full test suite and lineage registry is overkill — you'll spend more time maintaining it than it saves.
This architecture starts paying off when you hit the coordination threshold. Roughly when you're past 10–15 clients, when more than two or three people touch the reporting pipeline, or when a single client's ad spend is large enough that a reporting error becomes a relationship risk. Below that, a clean but simpler setup with a few sanity checks is enough.
When it's a bad idea
If your team has zero technical capacity and no real willingness to build any, forcing a full CI-style pipeline creates a system nobody maintains — which is worse than a simple system everyone understands. A half-maintained governance layer gives false confidence. Better to have three reliable manual checks than twenty automated ones that everyone ignores when they start throwing alerts.
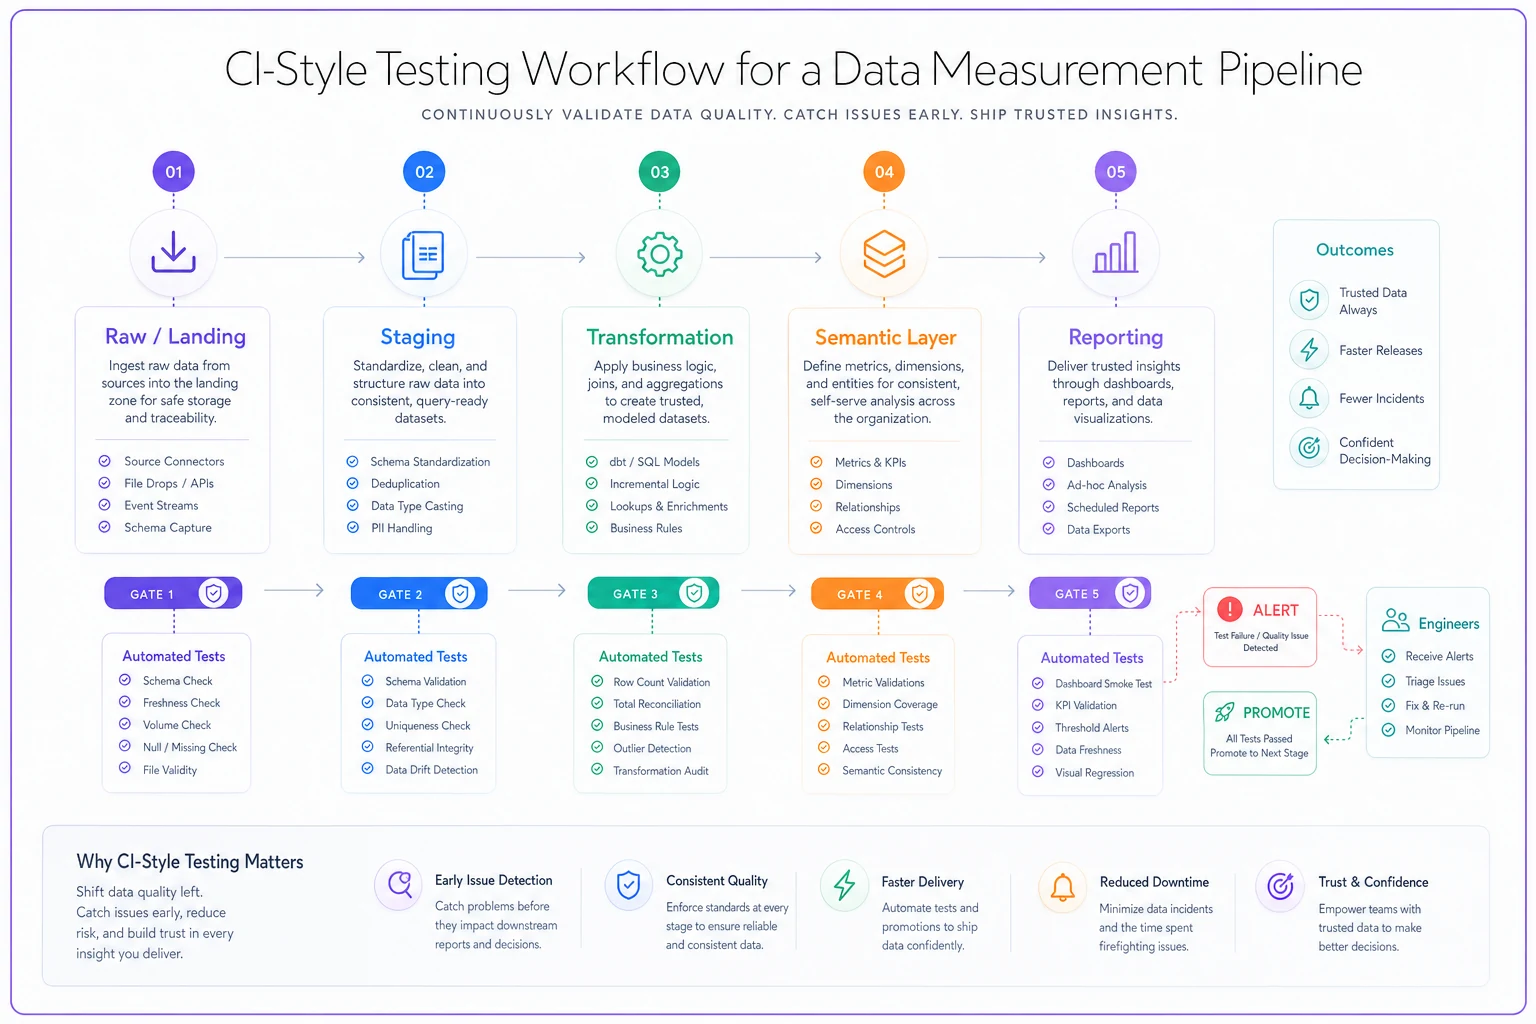
This sketch shows automated assertions and gates sitting between stages so failures are caught before promotion.
A real scenario
A mid-sized performance agency, around 22 clients, ran everything through a stack of connectors feeding directly into dashboards. No staging, no semantic layer, metric definitions living inside individual Looker Studio files.
The recurring pain: reconciliation discrepancies showed up in roughly one QBR out of four. Someone would spend the better part of a day tracing why the deck and the dashboard disagreed. Two clients had explicitly flagged "we don't fully trust these numbers" in the past year — the kind of comment that tends to resurface in a churn conversation.
They rebuilt in stages over about a quarter. Raw landing tables, a staging layer, a single semantic layer where ROAS, CPL, and qualified-lead definitions lived once. They added freshness and reconciliation gates plus a basic set of schema, uniqueness, and range tests that ran on every pipeline change.
The change wasn't dramatic on the surface — dashboards looked similar. But QBR discrepancies dropped to nearly none over the following two quarters. Forensics time on the rare disputes went from most of a day to under an hour, because lineage let them walk straight to the diverging stage. The two skittish clients stopped raising the trust question. Nobody could point to a single revenue number that jumped, but renewal conversations got noticeably easier when the agency could answer "where does this number come from" instantly and consistently.
Where the tooling fits
The gates, tests, and semantic definitions above are logic, not products — you can implement the core of this with dbt-style transformation tooling, a scheduler, and discipline. Where operational platforms earn their place is in the coordination overhead: keeping the lineage registry current automatically instead of by hand, surfacing gate failures to the right person instead of a dead Slack channel, and giving non-engineers visibility into which client reports are affected when a source breaks. The value isn't automation for its own sake — it's collapsing the time between "something broke" and "the right person knows and knows what it touches." That gap is where trust erodes, and it's the part that gets exponentially harder as client count grows.
The architecture matters more than the tool, though. A great tool wrapped around a pipeline with no layer separation, no gates, and no tests just breaks faster and more confidently.
Closing thought
Reporting problems almost never get diagnosed as pipeline problems. They get diagnosed as "our reporting person made a mistake" or "the platform's data is unreliable." Both misread the situation. The real issue is that data moved from source to client without anything checking whether it was right along the way.
Build the seams. Define metrics once. Put gates where layers meet. Test changes before they reach production. Keep a lineage map that isn't just in someone's head. None of it is exciting, and that's the point — a measurement platform architecture built this way is boring in exactly the way clients want. It just gives the same trustworthy answer every time, and tells you loudly when it can't.
Ready to elevate your agency's performance?
Join 2,000+ agencies using Digmaly to save time, boost efficiency, and deliver superior client results.