

The worst part of ad ops isn't the anomaly itself. It's the scramble that follows.
A CPA doubles overnight. A client emails asking why spend jumped 40% on Tuesday. Conversions flatline on one campaign but nowhere else. Suddenly three people on the account team are digging in three different directions — one checking the platform, one in GA4, one pinging the dev team about the pixel — while nobody writes down what they actually found. Two hours later there's a Slack thread with 47 messages, no clear cause, and a client still waiting.
That chaos isn't a skill problem. Most senior analysts can find root cause. The problem is that every investigation starts from zero, relies on tribal knowledge, and produces nothing reusable. Multiply that across 200 incidents a year and you're burning a genuinely absurd amount of billable time on work that should be templated.
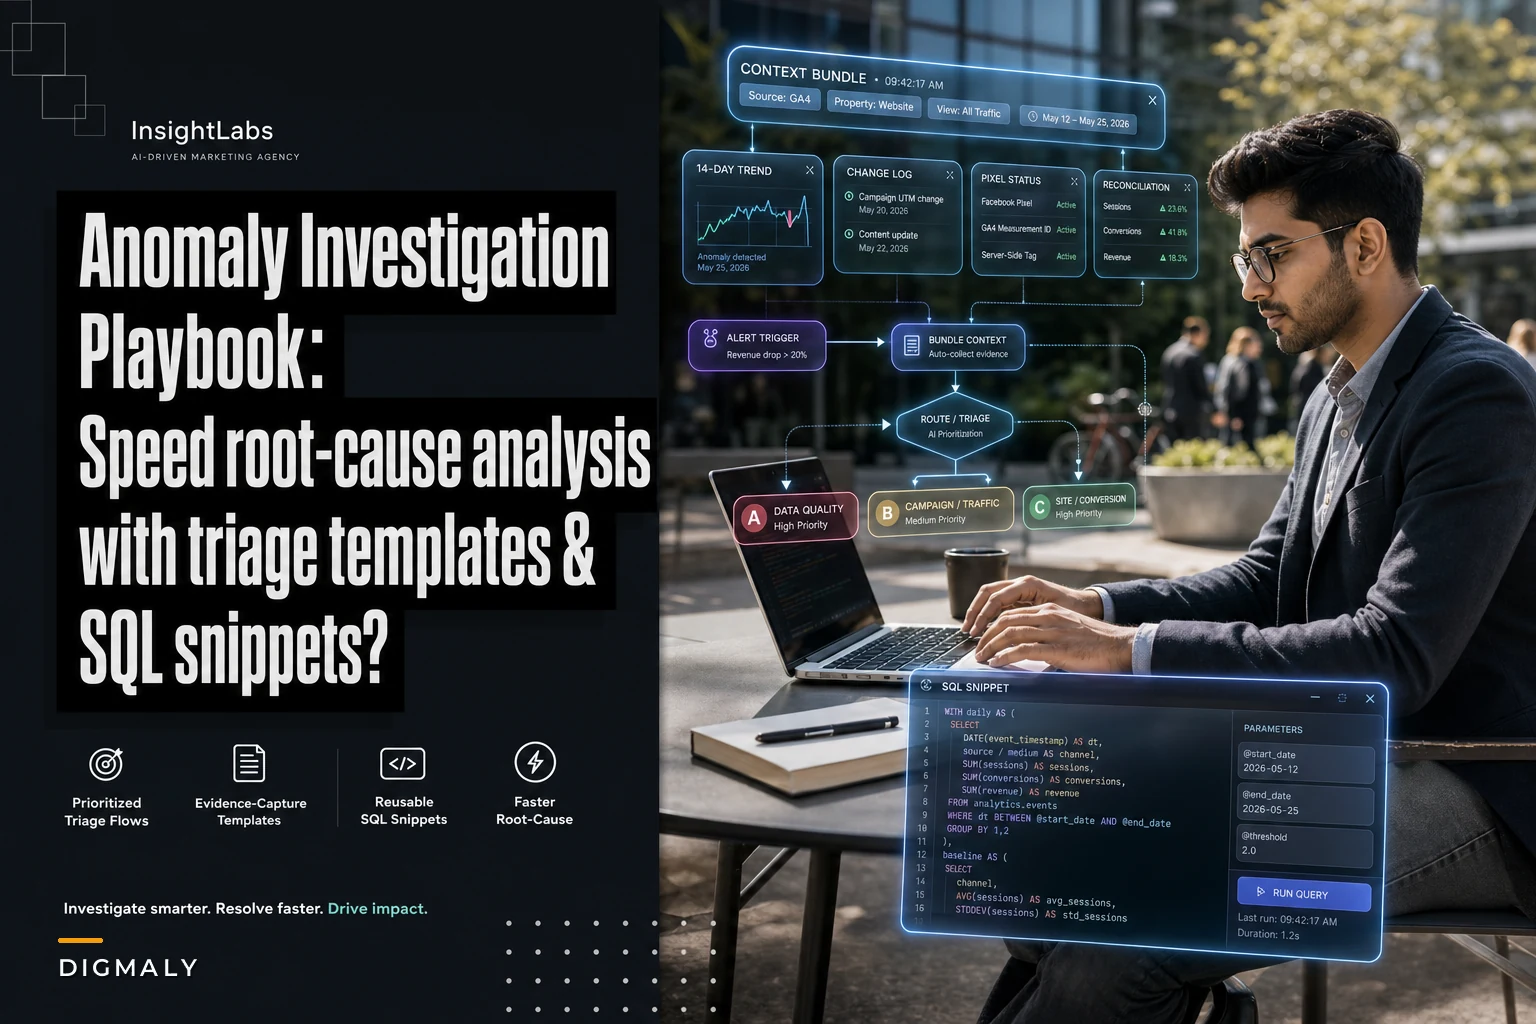
This is a walkthrough of how to build an anomaly investigation playbook your agency can actually run under pressure — prioritized flows, evidence-capture templates, and reusable SQL snippets — so root-cause analysis stops depending on who happens to be online that day.
The reason investigations balloon: no triage layer
Watch how a typical anomaly gets handled and the failure usually happens in the first five minutes, not the last hour.
-
Reporting lag / data freshness — conversions haven't backfilled yet, so today looks broken and self-corrects in 48 hours.
-
Expected variance — a Monday vs. Sunday comparison, a small-spend campaign with noisy CPA, or normal seasonality.
-
Known change — someone edited bids, budgets, or audiences yesterday and forgot to log it.
In practice, roughly half the "urgent" anomalies clients flag fall into one of those three. If your process can rule them out in the first two minutes, you never spin up a full investigation. Skipping this triage step is the single biggest reason investigations balloon — you spend an hour root-causing something that was never broken. So the playbook starts with classification, not exploration.
The triage decision layer
Before anyone touches SQL or opens a platform, the person picking up the alert works through a short triage sequence. The goal is to route the anomaly, not solve it.
Eliminate marketing chaos with streamlined campaign control.
Digmaly lets you plan, execute, and track every campaign effortlessly.
- Unified campaign management
- Real-time client reporting
- Collaborative team workflows
No credit card required
| Triage question | If yes → | If no → |
|---|---|---|
| Is the metric based on data younger than the platform's attribution/backfill window? | Mark watch, recheck in 24–48h | Continue |
| Is the affected spend meaningful (e.g. >~5% of account daily or >$X)? | Continue | Downgrade priority |
| Does the change exceed normal day-of-week variance for this account? | Continue | Close as expected variance |
| Is there a logged change (bid/budget/audience/creative) in the last 72h? | Investigate that change first | Continue to full flow |
| Is more than one channel/campaign affected simultaneously? | Suspect tracking/pipeline, not the platform | Suspect campaign-level cause |
That last row matters more than people expect. When a single campaign misbehaves, the cause is almost always inside that campaign — bid strategy reset, audience shrank, creative disapproved. When everything drops simultaneously, the platform is rarely the culprit. It's usually the pixel, a consent-mode change, a tag manager publish, or a broken data pipeline feeding your reports. Getting analysts to instinctively split "one campaign" vs. "everything" cuts investigation time substantially because it eliminates half the possible causes before anyone writes a query.
Prioritized investigation flows (not one giant checklist)
A common mistake is building a single 40-step anomaly checklist and expecting people to run all of it. Nobody does. They skim it, skip steps, and it slowly rots.
Flow A: CPA / cost spike, single campaign
-
Check budget vs. spend pacing for the day — did a budget increase or an auction shift push CPCs up?
-
Look at impression share and CPC trend over 7 days — is this a delivery/auction change or a conversion drop?
-
Split the metric
is CPA up because cost rose or because conversions fell? These have completely different causes.
-
If conversions fell — check the conversion action itself (still firing? recently edited?).
-
If cost rose — check bid strategy status and any recent "learning" reset from edits.
-
Check audience size and targeting for shrinkage or an accidental exclusion.
-
Capture findings in the evidence template (below) before proposing a fix.
Flow B: Conversions flatline or drop, multiple campaigns
-
Confirm the drop exists in the raw platform, not just your dashboard — rules out pipeline issues fast.
-
Check tag/pixel fire rate — did a site deploy, consent banner change, or GTM publish land near the drop?
-
Compare the drop timestamp against your deployment and change log.
-
Check for a domain, tracking template, or landing-page redirect change.
-
Validate against a second source (GA4, backend, CRM) — if the platform shows conversions but your DB doesn't, it's ingestion, not delivery.
-
Capture the exact timestamp of divergence — this is the piece of evidence that saves the client conversation.
The steps aren't exotic. The value is that they're ordered by probability and written down, so a junior analyst runs them in the same order a senior would, and nobody skips step 3.
Evidence-capture templates: the part everyone skips
There's an operational pattern that quietly costs agencies a lot: investigations that reach a conclusion but leave no trail. The analyst figures out the cause, fixes it, moves on — and two weeks later the same anomaly shows up on another account and everything starts from scratch.
-
Anomaly
metric, account, date range, magnitude
-
Triage result
real / watch / expected variance / known change
-
Scope
single campaign vs. account-wide
-
Timestamp of divergence
the exact hour things changed
-
Queries/checks run
linked, so the next person reuses them
-
Root cause
one sentence, plain language
-
Fix applied
what changed and when
-
Client-facing summary
2–3 sentences ready to paste
Capture the divergence timestamp precisely so you can correlate it to deploys and GTM publishes.
The "timestamp of divergence" field earns its keep fast. When a client pushes back — "are you sure it wasn't your bid change?" — being able to say "conversions diverged at 14:00 UTC, and your team published a GTM container at 13:52" ends the conversation in one line. Correlating anomalies to a change log is also core to keeping automated changes safe, which ties directly into having proper guardrails and rollback playbooks for campaign automation — because a meaningful portion of "anomalies" will eventually turn out to be your own automation doing exactly what you told it to.
Reusable SQL snippets and spreadsheet tests
The real time-saver isn't writing clever queries. It's not writing new queries every incident. Most investigations reuse the same handful of checks. Build them once, parameterize them, and store them somewhere the whole team can find them.
Day-over-day and week-over-week deviation by campaign — flags which campaigns actually moved vs. which are noise:
select campaignid, date, conversions, avg(conversions) over ( partition by campaignid order by date rows between 7 preceding and 1 preceding ) as trailing7davg, round(conversions / nullif(avg(conversions) over ( partition by campaignid order by date rows between 7 preceding and 1 preceding ), 0), 2) as ratiotoavg from campaigndaily where date >= currentdate - 14 order by ratioto_avg;
Anything with a ratiotoavg under ~0.6 or over ~1.6 is worth a look. Everything near 1.0 you ignore.
Cost-vs-conversion decomposition — one query that shows whether CPA moved because of cost or volume, so you don't guess at the cause. Source reconciliation check — platform conversions vs. your warehouse or CRM for the same window. A persistent gap that suddenly widens is almost always an ingestion or tracking problem, not a media problem. This pairs well with clear pacing and threshold logic like the kind covered in budget pacing alerts with threshold formulas and action SOPs, so cost anomalies get caught before a human even notices. For teams not comfortable in SQL, the same logic works in a spreadsheet test tab: pull the last 14 days, compute trailing averages, conditional-format anything outside the band. Less elegant, but it works and it's shared. One discipline that matters: every query gets a name, a note on when to use it, and what normal output looks like. A snippet nobody knows when to run is just clutter.
Automated context collection: what to gather before a human looks
Most of the first 20 minutes of any investigation is just assembling context — pulling the change log, the deploy history, 14 days of metrics, the pixel status. It's mechanical, and it's a good candidate for automation.
-
The affected metric with a 14-day trend and trailing-average deviation
-
Any logged changes in the last 72h (bids, budgets, audiences, creative status)
-
Recent site deploys or GTM publishes near the divergence timestamp
-
Pixel/tag fire rate for the window
-
Source-reconciliation gap (platform vs. warehouse)
-
Whether the anomaly is single-campaign or account-wide
Some agencies wire this together with their own scripts; others use AI-assisted operational tooling that watches metrics and drafts the context bundle automatically. That doesn't replace the analyst's judgment — the decision about root cause still belongs to a person. It just means the human starts already holding the evidence instead of spending 20 minutes gathering it.
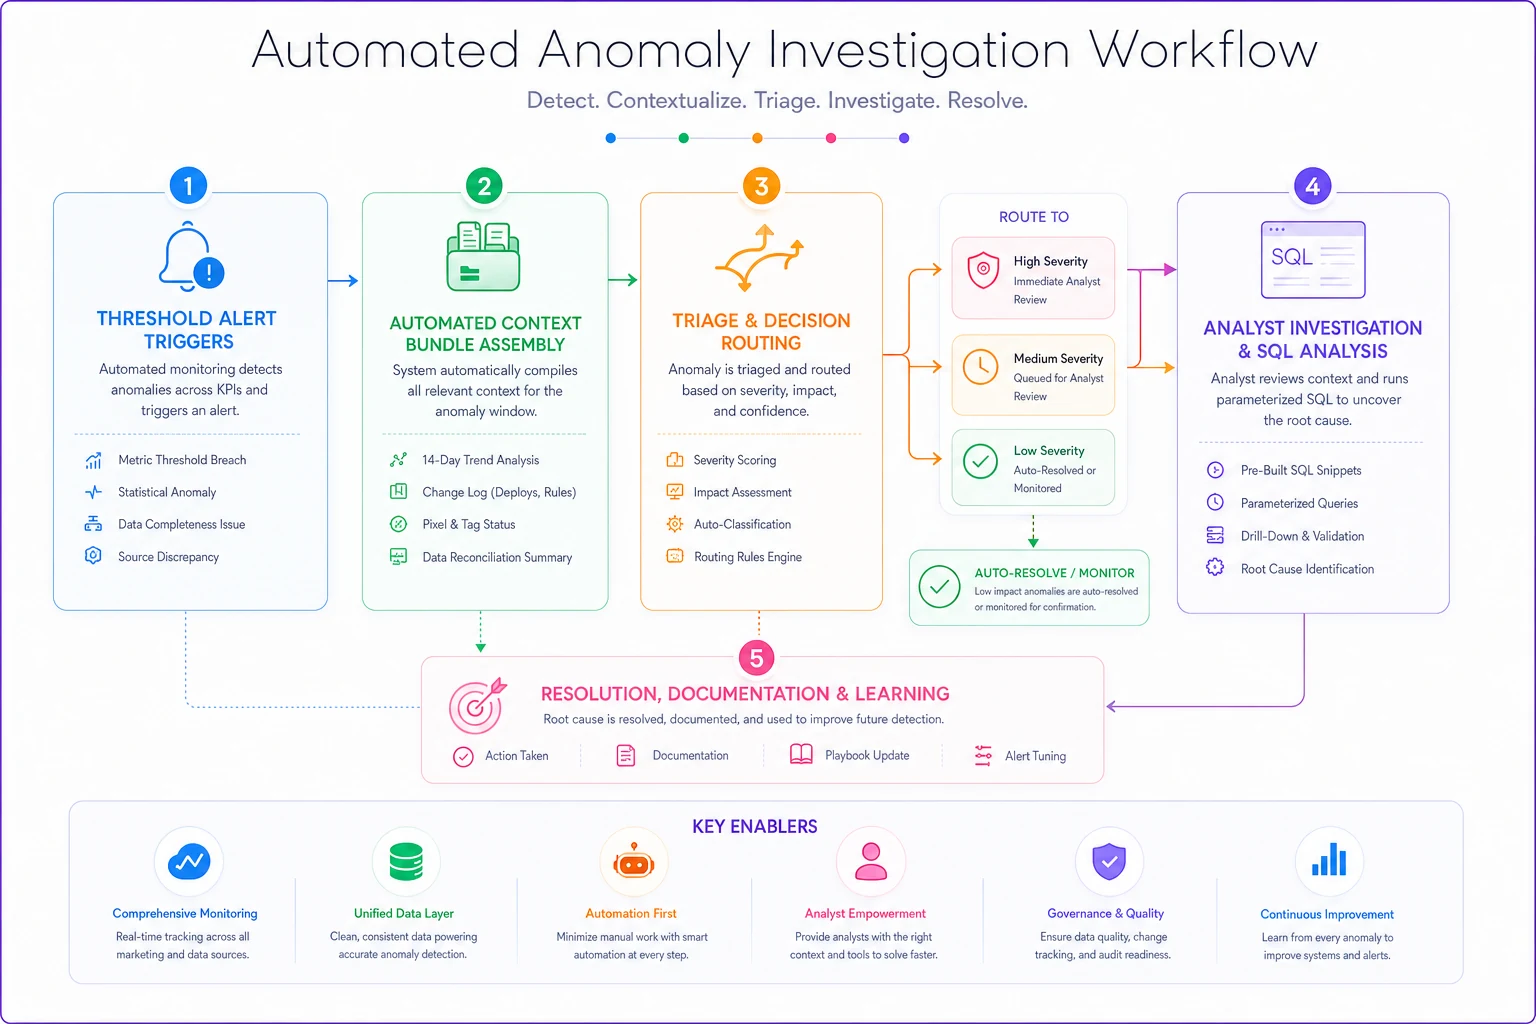
End to end, the workflow looks like this: threshold trips → context bundle auto-assembled → triage layer classifies → routed into the right flow → analyst runs the two or three relevant snippets → evidence template filled → client summary ready. What used to be an open-ended fire drill becomes a bounded, repeatable process.
When this level of playbook actually makes sense
Not every agency needs all of this. If you manage a handful of accounts and one senior person handles everything, formalizing it might be overkill — the tribal knowledge lives in one head and that's probably fine for now.
-
You have more accounts than senior analysts, so juniors handle first response.
-
Clients ask "why did this happen?" often enough that answering it is a recurring cost.
-
You've had at least one incident where a slow or wrong root-cause diagnosis actually damaged a client relationship.
-
Different team members investigate the same anomaly and reach different conclusions.
When it's a bad idea: don't build the full snippet library and automation before you've documented even one investigation manually. Teams that jump straight to tooling end up automating a process nobody agrees on. Run five or ten investigations with the evidence template first, see which checks actually recur, then codify them.
Who should hold off: solo operators or two-person shops with a single client type. Your "playbook" can be a one-page note. The overhead of maintaining flows and snippets isn't worth it until volume and team size force the issue.
A realistic before/after
A mid-sized performance agency managing around 30 e-commerce accounts had a recurring problem: any CPA spike turned into a half-day event. First response was inconsistent, senior analysts kept getting pulled into junior investigations, and a few times they told a client "it was seasonality" only to discover a week later it was a broken conversion tag.
They didn't buy anything exotic. They built a triage table, two investigation flows (cost spike, conversion drop), an evidence-capture doc template, and about six reusable queries. Then they added automated context collection so alerts arrived with the trend, change log, and reconciliation gap already attached. The impact was less about any single metric and more about consistency. Investigations that used to run two-plus hours started closing in under 30 minutes. More importantly, the wrong diagnoses mostly disappeared — because the "check the raw platform and the deploy log first" steps started catching tracking issues that had previously been misread as media problems. Senior analysts stopped being the bottleneck for every incident, and client "why did this happen?" emails started getting answered same-day with an actual timestamp and cause.
Where to start this week
You don't need to build all of it at once. The highest-leverage piece is the part everyone skips: capturing evidence so investigations become reusable.
-
Write the triage table and pin it where alerts land.
-
Create the evidence-capture template — even a plain doc with fixed fields.
-
Document your next three real investigations using it, exactly as they happen.
-
Look at which checks kept repeating, and turn those into named, reusable queries or a spreadsheet test tab.
-
Only then, automate the context collection so the mechanical 20 minutes of gathering disappears.
The agencies that handle anomalies calmly aren't the ones with the sharpest analysts. They're the ones that stopped treating every spike as a brand-new mystery — and turned root-cause analysis into something the whole team runs the same way, every time.
The agencies that handle anomalies calmly aren't the ones with the sharpest analysts. They're the ones that stopped treating every spike as a brand-new mystery — and turned root-cause analysis into something the whole team runs the same way, every time.
Ready to elevate your agency's performance?
Join 2,000+ agencies using Digmaly to save time, boost efficiency, and deliver superior client results.