

Every month, digital agencies waste 15-30 hours assembling performance reports that clients skim for three minutes before asking "but what does this mean for my business?" The real damage isn't just the time sink—it's watching account managers become glorified data entry clerks while actual strategic work gets pushed aside.
Most agencies think the answer is prettier dashboards or more automation. They're missing the point. The problem runs deeper than tools. It's about having zero governance around what gets reported, why it matters, and how different client types need fundamentally different narratives around the same data points.
Across hundreds of engagements, the pattern becomes obvious: reactive reporting happens when there's no framework defining what constitutes meaningful performance for each client archetype. You end up with account managers pulling whatever metrics look good that month, building custom narratives from scratch, and hoping the client doesn't ask too many questions.
The hidden cost of ungoverned reporting
The typical agency reporting workflow looks straightforward. Account manager exports data from various platforms, drops numbers into a template, writes some commentary, sends to client. Maybe takes 3-4 hours per client. Multiply by 20 clients and suddenly your team is burning a full work week on reports every month.
That's just the visible cost. The real damage happens in the gaps between those steps.
Without a governance framework, each account manager develops their own interpretation of what matters. One focuses on CTR improvements while another emphasizes conversion volume. The ecommerce client gets the same KPI focus as the B2B SaaS client. Nobody notices until a client asks why their reports look different from their friend's agency reports, or when they hire a consultant who questions your entire measurement approach.
Then there's the escalation chaos. A metric drops 20%—is that worth flagging? What about 30%? Different account managers make different calls. Some clients get alerted about minor fluctuations while others don't hear about major issues until the monthly report. Trust erodes. Clients start asking for "quick updates" between reports. The reactive cycle intensifies.
Your best account managers—the ones who actually understand strategy—spend their time formatting spreadsheets instead of identifying growth opportunities. They know something's broken but can't articulate exactly what because the entire system feels both necessary and wrong.
Why client archetypes destroy generic templates
Generic reporting templates fail because different business models care about fundamentally different outcomes. An ecommerce brand obsessing over ROAS operates in a completely different reality than a B2B company tracking pipeline velocity. Most agencies force both through the same reporting structure, then wonder why clients seem confused or disengaged.
Eliminate marketing chaos with streamlined campaign control.
Digmaly lets you plan, execute, and track every campaign effortlessly.
- Unified campaign management
- Real-time client reporting
- Collaborative team workflows
No credit card required
What actually matters to different client types:
Ecommerce brands live and die by the relationship between ad spend and revenue. They need to see customer acquisition costs trending against lifetime value, inventory turnover affecting campaign performance, and seasonal patterns compared to previous years. A 15% drop in CTR means nothing if conversion rates improved and average order value increased.
Local service businesses couldn't care less about impressions or engagement rates. They need cost per booked appointment, show rate trends, and territory performance. Their entire business model revolves around filling appointment slots efficiently. Showing them a social media engagement report is like giving a fish a bicycle.
B2B SaaS companies play an entirely different game. They're tracking marketing qualified leads through sales cycles that might take months. Demo requests matter more than purchases. Trial-to-paid conversion rates trump everything. They need cohort analyses and attribution modeling that connects marketing touches to eventual contract values.
Professional services firms need pipeline visibility above all else. How many consultations led to proposals? What's the average proposal value by source? How long from first touch to signed engagement? They're not buying traffic; they're investing in relationship building.
Without templates that speak each archetype's language, account managers end up translating on the fly. They pull generic metrics, then scramble to explain why those numbers matter to that specific client's business model. It's exhausting, inefficient, and produces mediocre results that satisfy nobody.
Building a KPI taxonomy that scales
A proper KPI taxonomy starts with understanding that metrics exist in a hierarchy. Not all numbers deserve equal attention. Some indicate immediate action needed, others provide context, and many just create noise.
The taxonomy needs three levels minimum:
| Level | Description |
|---|---|
| Primary KPIs | The 3-5 metrics that directly indicate business health for that client type. For ecommerce, it might be revenue, ROAS, and new customer acquisition cost. For B2B, it could be qualified leads, pipeline value, and cost per opportunity. These get tracked weekly, reported monthly, and any significant deviation triggers immediate investigation. |
| Supporting metrics | The 8-12 numbers that explain movement in primary KPIs. If customer acquisition cost increases, supporting metrics like CPM, CTR, and conversion rate tell you where the breakdown happened. These provide diagnostic capability without overwhelming the narrative. |
| Context indicators | Everything else that might occasionally matter but doesn't drive decisions. Impressions, reach, engagement—useful for specific investigations but deadly when given equal weight to business metrics. These stay in appendices or supplementary dashboards. |
Governance becomes critical here. The taxonomy must be documented, agreed upon with the client during onboarding, and enforced religiously. No account manager gets to suddenly promote a context indicator to primary status because it spiked this month. No client gets to demand tracking 47 custom metrics that dilute focus from what actually matters.
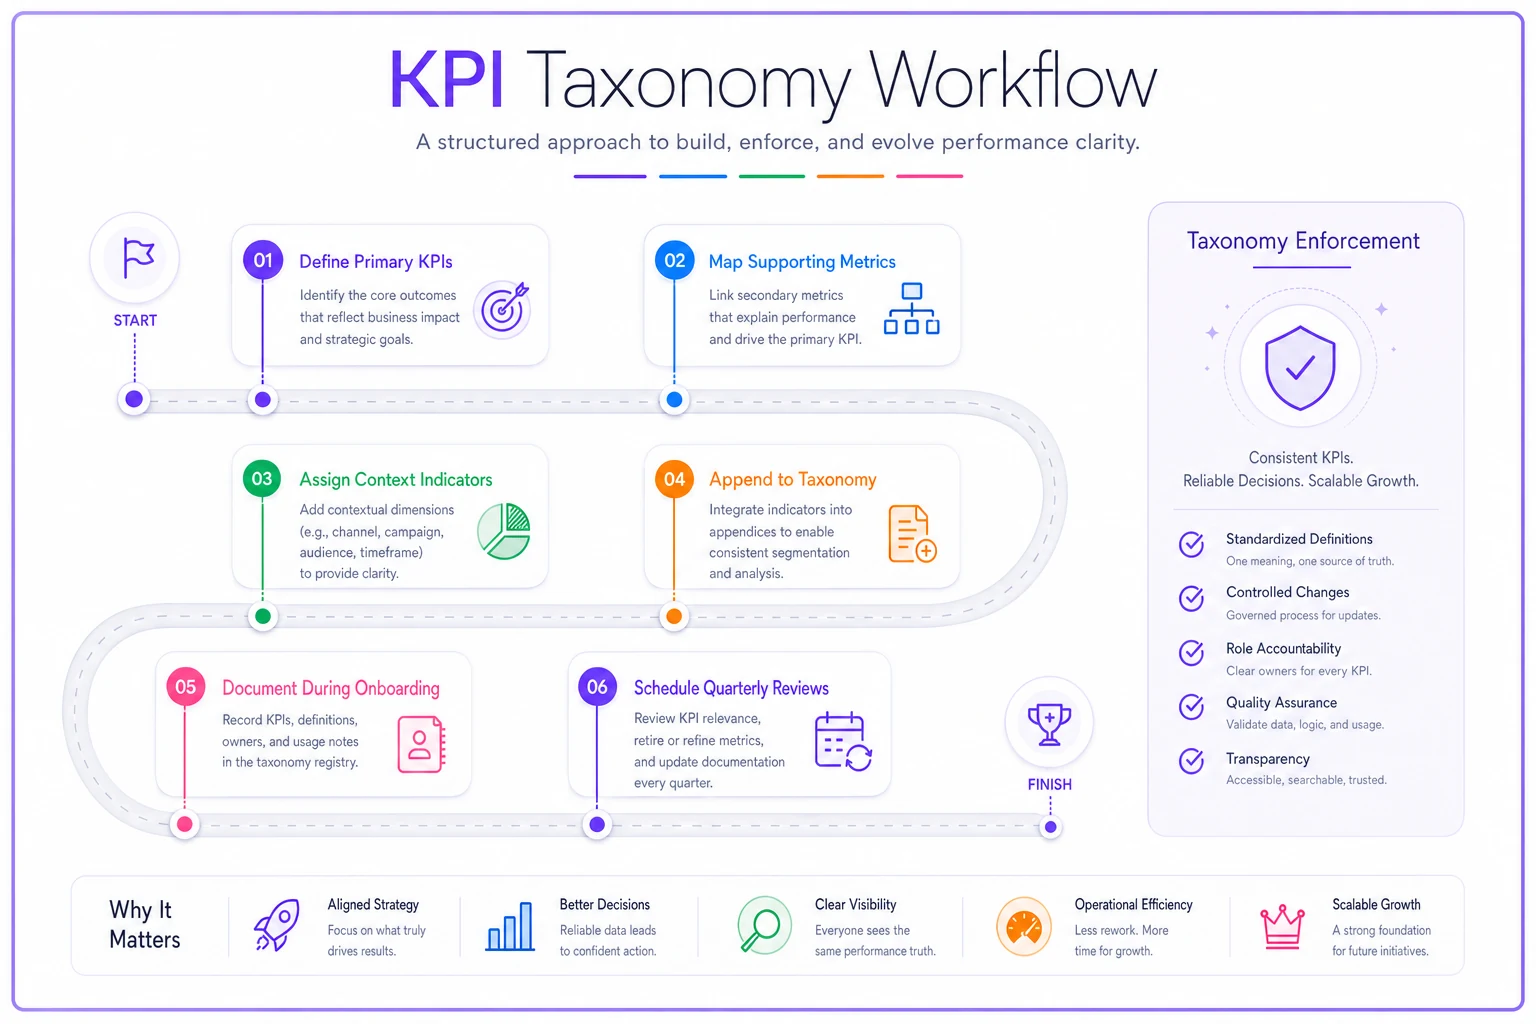
Here's a simple visual of the taxonomy workflow.
The enforcement mechanism matters too. Regular taxonomy reviews—maybe quarterly—where you assess whether the chosen metrics still reflect business priorities. Markets change, businesses evolve, and your taxonomy needs controlled adaptation, not constant reactive shuffling.
Narrative templates that tell the right story
Numbers without narrative are just decoration. Most agencies either provide no context ("Here are your metrics") or write novels nobody reads. The solution isn't finding the perfect word count—it's having templates that structure narrative around business outcomes rather than channel performance.
A governance-first narrative template for ecommerce might follow this structure:
Business outcome summary - Start with what happened to revenue and profitability, not what happened to ads. "Revenue increased 23% month-over-month while maintaining efficiency at 4.2x ROAS."
Primary driver analysis - Identify the 1-2 biggest factors behind the outcome. "Growth came primarily from improved conversion rates on shopping campaigns (up 31%) rather than increased traffic."
Risk and opportunity flags - What needs attention? "Mobile conversion rates continue lagging desktop by 40%, representing roughly $45K in monthly missed revenue."
Next period focus - Specific actions, not vague intentions. "Testing dynamic retargeting audiences in week 1, expecting 15-20% efficiency improvement based on similar client performance."
Compare that to the typical agency narrative that starts with impressions, walks through each platform's performance, and maybe mentions revenue in paragraph four. The governed template forces value-first storytelling that connects marketing activity to business outcomes.
Different client archetypes need different narrative flows. B2B templates might lead with pipeline development and sales cycle acceleration. Local services focus on appointment efficiency and territory performance. The template doesn't just change the metrics shown—it restructures the entire story arc.
Escalation rules that prevent fires
Most agencies discover problems when clients call angry. By then, the issue has festered for weeks and trust is already damaged. Proper escalation rules catch problems early and, more importantly, demonstrate proactive management.
Escalation triggers need clear thresholds based on business impact, not arbitrary percentage changes. A 30% drop in impressions might mean nothing. A 10% increase in customer acquisition cost could signal disaster. The rules must reflect what actually threatens the client's business model.
Consider a tiered escalation framework:
Tier 1 - Immediate notification triggers when business-critical metrics breach defined thresholds. Customer acquisition cost exceeding lifetime value. Conversion rates dropping below break-even points. Cost per appointment approaching service margins. These get flagged within 24 hours with a specific action plan.
Tier 2 - Weekly monitoring catches concerning trends before they become critical. Three consecutive days of declining ROAS. Pipeline velocity slowing 20% week-over-week. These get discussed in weekly check-ins with remediation strategies.
Tier 3 - Monthly reporting covers everything else. Normal fluctuations, seasonal patterns, experimental campaigns. These follow standard reporting cycles without special attention.
Define these thresholds during onboarding, not through painful experience. What would genuinely threaten this client's business? What early warning signs indicate trouble ahead? What normal fluctuations should we ignore?
Documentation matters here. When you do escalate, reference the agreed-upon rules. "As discussed during onboarding, we're flagging this because CAC exceeded the $200 threshold we established." It transforms escalation from reactive panic to proactive management.
From reports to revenue: the invoice connection
Clients mentally connect reporting quality to invoice value. Mediocre reports make that monthly retainer feel expensive. Clear, business-focused reports make the same retainer feel like a bargain.
The connection becomes explicit when you map reporting elements directly to value delivery. Instead of charging "$5,000/month for management," break it down:
-
Strategic optimization based on weekly KPI monitoring
$2,000
-
Proactive escalation and issue resolution
$1,500
-
Monthly performance analysis and recommendations
$1,000
-
Platform management and tactical execution
$500
Now each report section demonstrates specific value delivery. The KPI analysis justifies the optimization fee. Escalation examples validate the issue resolution charge. Recommendations support the analysis fee. Suddenly the invoice makes sense because the report proves the work happened.
This mapping also reveals reporting gaps. If you're charging for strategic optimization but reports only show tactical metrics, the disconnect becomes obvious. Either adjust the reporting to demonstrate strategy or adjust the pricing to reflect what you actually deliver.
Some agencies take this further, creating performance-based pricing tiers tied to their KPI taxonomy. Base fee covers platform management and reporting. Performance fees trigger when primary KPIs hit specific targets. The reporting framework becomes the measurement system for variable compensation, aligning agency and client incentives.
The compound effect of governance
Implementing a governance-first reporting framework feels like overkill initially. Creating taxonomies, documenting templates, defining escalation rules—it's substantial upfront work. But the compound effect kicks in quickly.
Month one: Account managers stop reinventing reports from scratch. They follow templates, reference taxonomies, apply escalation rules. Time per report drops from 4 hours to 2.
Month three: Clients stop asking "what does this mean?" because narratives consistently connect metrics to business outcomes. Strategic discussions replace data interrogations.
Month six: New team members onboard faster because reporting governance provides clear structure. Quality becomes consistent across all accounts. Client satisfaction scores improve.
Month twelve: You're spending 70% less time on reporting while delivering dramatically better strategic value. Account managers focus on optimization instead of Excel. Clients renew at higher rates because they understand exactly what they're paying for.
The framework also scales well. Adding new client types means creating new templates, not rebuilding everything. Growing the team means training on existing governance, not hoping new hires figure it out. Taking on enterprise clients means expanding taxonomies, not starting from scratch.
Implementation without disruption
The biggest mistake agencies make is trying to revolutionize reporting overnight. Clients comfortable with their current reports suddenly receive completely different documents. Account managers struggle with new frameworks while maintaining daily operations. Chaos ensues.
Smart implementation happens gradually. Start with new clients—they don't have expectations about report format. Build and refine templates with fresh engagements where you can establish governance from day one.
Start with new clients when rolling out templates to avoid disrupting existing relationships.
For existing clients, introduce changes incrementally. Maybe start by adding the KPI taxonomy to existing reports as an "executive summary" section. Next month, restructure the narrative slightly. Month three, introduce escalation thresholds. By month six, you've transformed the entire report without jarring transitions.
Get account manager buy-in by involving them in template creation. They know what questions clients actually ask. They understand which metrics cause confusion. Their input makes templates practical rather than theoretical.
The technology stack matters less than the governance framework, but smart automation helps. Instead of complex BI tools that require technical expertise, consider operational platforms that codify your governance rules. When KPI taxonomies, narrative templates, and escalation triggers exist in software rather than documents, consistency happens automatically.
Measuring reporting ROI
Most agencies never measure whether better reporting actually improves business outcomes. They assume clients prefer good reports but don't quantify the impact. This misses the opportunity to justify premium pricing through demonstrated value.
Track metrics that matter to your agency's health:
Time to report completion - How long from month-end to report delivery? Governance should cut this by 50-70%.
Account manager utilization - What percentage of their time goes to strategic work versus report assembly? This should flip from 30/70 to 70/30.
Client retention rate - Do clients with governed reporting renew more often? Usually see 20-30% improvement.
Upsell velocity - How quickly do clients expand engagements? Better reporting accelerates trust and budget increases.
Referral rate - Do clients receiving governed reports refer more often? Clear value demonstration makes recommending easier.
The numbers tell a clear story. Agencies implementing governance-first reporting typically see account manager capacity increase 40%, client lifetime value grow 25%, and profit margins expand 15-20% through operational efficiency.
Beyond reactive dashboards
The real transformation happens when reporting stops being a monthly obligation and becomes a strategic asset. Clients start treating reports as planning documents rather than historical records. Account managers shift from data compilers to strategic advisors. The entire agency-client relationship elevates.
This isn't about perfect templates or beautiful dashboards. It's about creating systematic governance that ensures every report delivers clear business value. When KPI taxonomies define what matters, narrative templates explain why it matters, and escalation rules prevent surprises, reporting becomes proactive rather than reactive.
The agencies winning tomorrow won't be the ones with the prettiest dashboards or the most metrics. They'll be the ones whose reporting governance makes performance transparent, actionable, and directly connected to client success. The framework exists. The question is whether you'll implement it before your competitors do.
Stop treating reporting as a necessary evil. Start treating it as the strategic foundation that justifies premium pricing, builds unshakeable client trust, and scales your agency beyond the monthly scramble. The path from reactive dashboards to governed performance reporting is clear. The only thing standing in the way is the decision to begin.
Ready to elevate your agency's performance?
Join 2,000+ agencies using Digmaly to save time, boost efficiency, and deliver superior client results.