
Your creative team just pitched fifteen headline variations for a Black Friday campaign. The client loves them all. Marketing wants to test everything. Meanwhile, you're staring at a $3,000 monthly test budget wondering how anyone expects statistically significant results from testing fifteen variants across four audiences on three platforms.
This disconnect between creative ambition and testing reality kills more agency experiments than bad creative ever could.
Most agencies approach A/B testing backwards. They create variations first, then scramble to figure out sample sizes, budgets, and timelines. By the time someone realizes the math doesn't work, creative's already built everything, the client expects results next week, and you're forced to run underpowered tests that prove nothing except that someone should have done the math earlier.
Why agency testing keeps failing at the operational level
The core problem isn't testing knowledge. Your team probably understands statistical significance. They know about control groups. Someone can explain confidence intervals. But operational reality hits different than textbook testing theory.
A typical agency testing cycle: Client approves testing budget Monday. Creative delivers eight ad variations Wednesday. Media team discovers they need 2,400 conversions per variant for significance Thursday. Client averages 180 conversions monthly total. Nobody caught this mismatch until creative already burned twenty hours on variations that mathematically cannot produce meaningful results within the client's timeline.
Three failure patterns emerge from this misalignment.
Sample size calculations happen too late in the process. Teams design elaborate multivariate tests without checking if the client's traffic can support them. An ecommerce brand doing 500 transactions monthly cannot run a proper sixteen-variant creative test. The math doesn't work. Yet agencies regularly pitch these impossible experiments because nobody runs sample calculations during planning.
Budget allocation ignores testing requirements. Splitting $2,000 across twelve ad sets means roughly $166 per variant. With a $40 cost per acquisition, that's four conversions per variant. No statistical test on earth produces reliable insights from four data points. But this happens constantly because budget discussions and test design happen in separate meetings.
Dashboard design assumes infinite data. Teams build gorgeous reporting templates showing conversion rate improvements down to the second decimal place. Except when your test groups have seventeen and twenty-three conversions respectively, that 2.34% lift calculation means absolutely nothing. The confidence intervals are so wide you might as well flip a coin.
These aren't knowledge problems. They're workflow problems that require operational solutions.
Sample sizing rules that actually work with agency constraints
Real agency testing starts with honest math about client constraints. Not theoretical perfect-world calculations, but practical formulas that acknowledge budget realities.
Eliminate marketing chaos with streamlined campaign control.
Digmaly lets you plan, execute, and track every campaign effortlessly.
- Unified campaign management
- Real-time client reporting
- Collaborative team workflows
No credit card required
Start with the minimum detectable effect worth the client's time. Most agencies default to detecting 10% improvements because it sounds reasonable. But if a client's baseline conversion rate is 2%, a 10% relative improvement means detecting the difference between 2.0% and 2.2%. At typical agency budgets, reaching statistical significance for that tiny absolute difference takes months.
Instead, size experiments for 25-30% relative improvements minimum. Yes, that means missing smaller wins. But it also means running conclusive tests in two weeks instead of two months. For a client converting at 2%, test for differences between 2.0% and 2.5% or higher.
The operational formula:
Required conversions per variant = 16 × (1/baseline rate) × (1/minimum effect squared)
-
For that 2% baseline testing for 25% improvement
-
16 × 50 × 16 = 12,800 impressions per variant minimum - At $20 CPM, that's $256 per variant just for top-funnel reach
This immediately tells you whether the test is feasible. No guessing. No hoping. Just math.
But agencies usually mess up the translation from math to operations. They calculate required sample sizes, confirm the client has enough traffic, then launch tests that still fail. Why? Because they ignored time constraints.
A client might generate 10,000 monthly conversions, making a 400-conversion-per-variant test seem feasible. Except the client needs results in five days for a board presentation. Now you need 2,400 conversions daily, not 10,000 monthly. The time dimension breaks what looked like a valid test design.
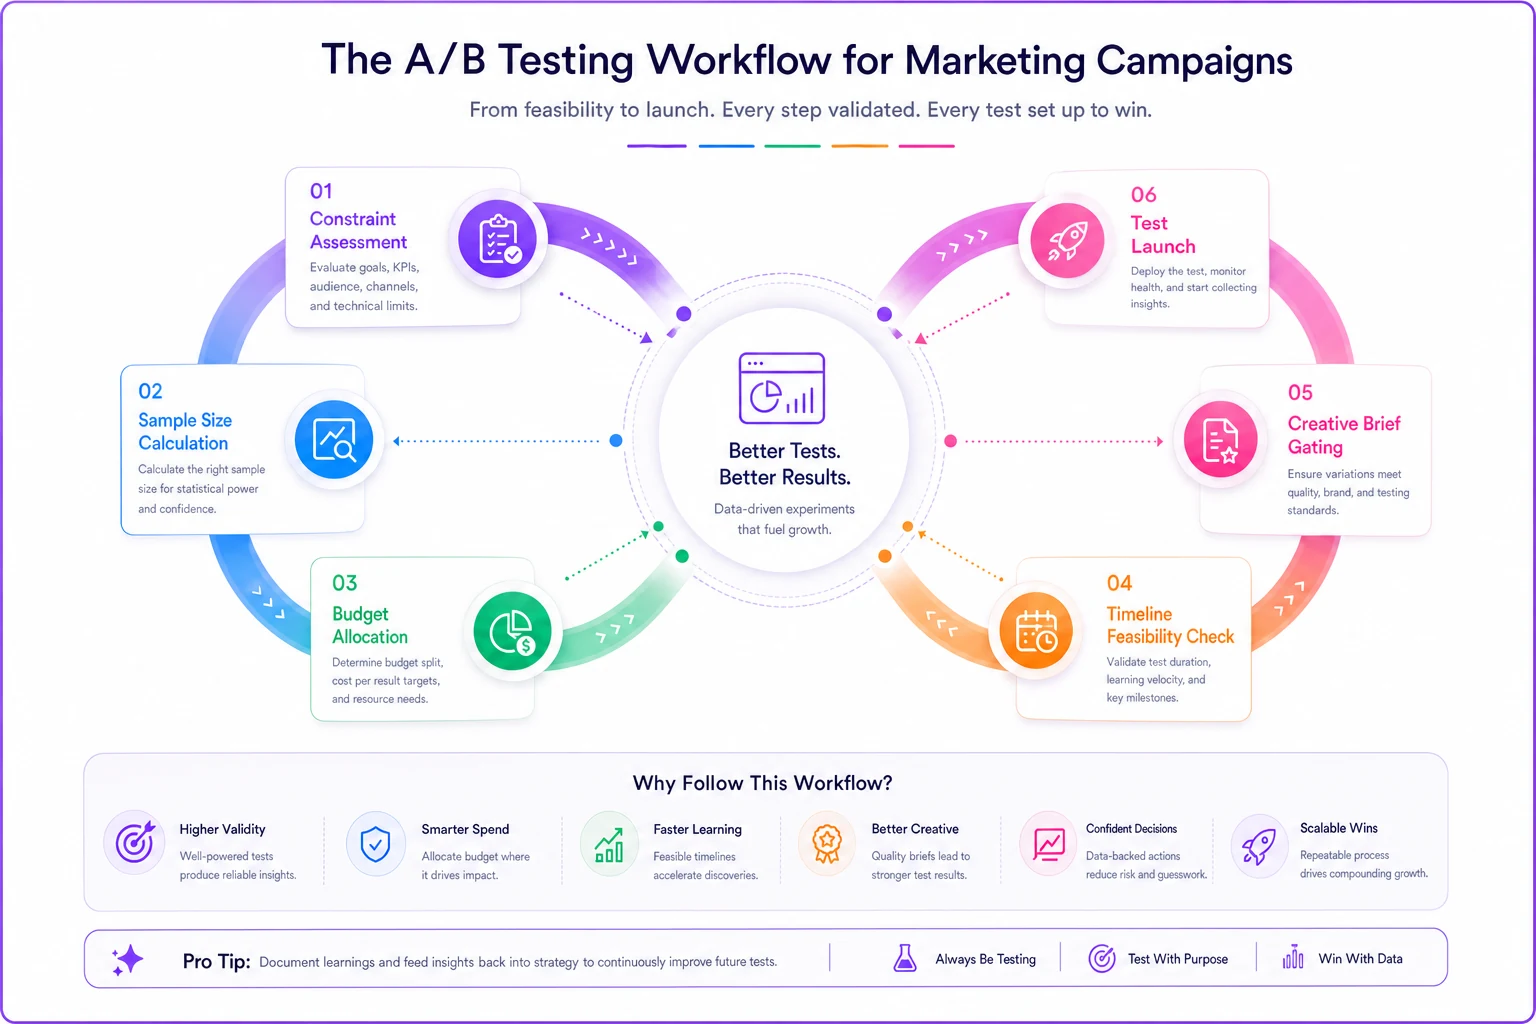
The time dimension often flips feasible designs into impossible ones; visualizing the workflow helps teams catch those breaks earlier.
Dashboard architecture for constrained test budgets
Standard testing dashboards assume you're Netflix running experiments on millions of users. Agency dashboards need different architecture that acknowledges you're testing with hundreds, not millions, of conversions.
The critical difference: confidence intervals must be the primary visual element, not hidden in small print. When your test has forty-seven conversions in control and fifty-three in variant, that 12.7% "improvement" comes with confidence intervals spanning from -8% to +35%. The dashboard must scream this uncertainty, not bury it under precise-looking percentages.
Dashboard structure that actually serves constrained testing:
Primary view: Test power status
-
Current sample size vs. required (visual progress bar)
-
Days remaining to reach power at current traffic
-
Confidence interval width (not just the point estimate)
Secondary view: Actual results
-
Results shown ONLY after reaching 80% of required sample
-
Confidence intervals displayed larger than point estimates
-
"Not yet conclusive" watermark for underpowered segments
Forbidden elements:
-
Conversion rate tables with more than one decimal place
-
"Winning" variant labels before statistical significance
-
Cumulative charts that make random early variations look like trends
When dashboards show precise percentages from day one, clients fixate on meaningless early variations. When dashboards show progress toward statistical power first, clients understand testing as a process, not a slot machine.
One approach that works: the "testing speedometer" dashboard. Instead of showing current results, it shows testing velocity. How many conversions per day are you collecting? At this rate, when will you reach significance? If you need results by Friday, what daily conversion rate gets you there?
This reframes conversations from "is the variant winning?" to "how can we accelerate data collection?" That second question has operational answers. The first just creates anxiety about random variance.
Reusable brief templates that prevent creative waste
Creative briefs for testing need different DNA than standard creative briefs. They must encode testing constraints directly into the creative process, not treat testing as an afterthought.
A functional testing brief starts with mathematical constraints, then works backward to creative possibilities. Not the other way around.
The template structure that prevents wasted creative work:
Testing constraints (filled by ops/media before creative starts):
-
Maximum variants math allows
[calculated from budget/timeline]
-
Required sample per variant
[specific number]
-
Days to reach significance
[at current traffic rates]
-
Test isolation requirements
[what must stay constant]
Then and only then, creative parameters:
-
Variable elements within test constraints
-
Hypothesis for each variation
-
Success metrics linked to sample calculations
The critical addition: a "variation budget" that treats test slots like a scarce resource. If math allows four variants maximum, creative gets four slots. Period. This forces prioritization before production, not after.
Example brief that actually works:
"Black Friday email campaign test. Budget allows 3 variants maximum (need 850 conversions each, have 2,600 expected total). Test hypothesis: subject line urgency drives opens more than discount percentage. Constants: sender name, preview text, send time. Variables: subject line only. Variant A: time-based urgency. Variant B: inventory urgency. Variant C: social proof urgency. Creative delivers subject lines only. Body content remains constant."
Compare that to typical testing briefs: "Test different Black Friday messages. Try various approaches. See what resonates." That second brief produces fifteen variants, burns creative hours, and generates tests that can't possibly reach significance.
Budget threshold formulas for different test types
Not all tests require the same statistical rigor. A font color test doesn't need the same power as a pricing strategy test. Agencies need budget allocation rules that match test importance to resource investment.
This tiering prevents the common agency mistake of running twenty dollar font tests with the same rigor as two thousand dollar pricing tests. It also sets client expectations appropriately. Want to test button colors? Fine, but understand we're looking for huge improvements, not marginal gains.
| Test Tier | Test Type | Min Budget Per Variant | Required Confidence | Min Detectable Effect |
|---|---|---|---|---|
| Tier 1 | Strategic (pricing, offers, positioning) | 20x typical CAC | 95% | 20% |
| Tier 2 | Tactical (headlines, images, CTAs) | 10x typical CAC | 90% | 30% |
| Tier 3 | Polish (colors, fonts, micro-copy) | 5x typical CAC | 80% | 40% |
The budget formula becomes: Test budget = (CAC × multiplier × variant count) + 20% buffer
That 20% buffer handles platform learning phases, audience overlap, and other real-world inefficiencies that theoretical calculations ignore.
Practical example: Client wants to test three landing page headlines. CAC is $45. Tier 2 tactical test means 10x multiplier. Budget needed: $45 × 10 × 3 × 1.2 = $1,620 minimum. Below that threshold, don't run the test. You're just generating noise.
Why isolated variable testing breaks in agency reality
The textbook says test one variable at a time. Agency reality says the client needs new creative, new landing pages, and new audiences tested before the quarterly board meeting in three weeks.
Rather than pretend agencies will suddenly embrace scientific method purity, here's a framework for managing multi-variable chaos while maintaining some statistical validity.
Test hierarchy framework:
-
Level 1
Platform/placement tests - Run these first with identical creative. One week minimum. This establishes baseline performance differences between channels.
-
Level 2
Message/offer tests - Same creative execution, different core value props. Run within winning platforms from Level 1.
-
Level 3
Creative execution tests - Same message, different presentations. Only after message validation.
This hierarchy means you're technically running nested tests, not isolated variables. But you're nesting them in a logical order that produces actionable insights even if you can't achieve perfect statistical isolation.
The documentation for this approach matters enormously. Each test needs a simple one-page summary showing what level it is, what findings it builds on, what's held constant, and what subsequent tests it enables.
Converting test results into reusable creative principles
Most agencies run tests, pick winners, then start fresh with the next test. The operational value evaporates after each campaign. Building reusable test documentation changes this dynamic.
The framework centers on pattern documentation, not just winner selection. After running fifty headline tests across twenty clients, patterns emerge. But only if someone documents them in an operationally useful way.
The documentation template that actually gets referenced:
-
Test principle [One sentence generalization]
-
Validation strength [Number of confirming tests]
-
Context boundaries [Where this does/doesn't apply]
-
Magnitude range [Typical improvement range seen]
-
Application checklist [Specific implementation steps]
Real example from agency data: "Test principle: Specific numbers outperform percentages in B2B email subjects. Validation: 14 of 17 tests confirmed. Context boundaries: Works for case studies and ROI claims, not for discount offers. Magnitude: 18-35% open rate improvement. Application: Replace '%' claims with absolute numbers, add context for scale, test number placement in subject."
This transforms testing from one-off experiments to cumulative knowledge building. New team members inherit tested principles, not just hunches. Clients see systematic improvement, not random wins.
The critical element: boundary conditions. Every principle has contexts where it fails. Documenting these prevents misapplication. "Urgency increases conversion" might be true for e-commerce but destructive for luxury brands. The documentation must capture these nuances.
Platform-specific sample size adjustments
Facebook's algorithm needs different sample sizes than Google's. TikTok's auction mechanics change the math entirely. Agency testing templates must account for platform mechanics, not just statistical theory.
Facebook's Advantage+ campaigns, for instance, automatically distribute budget toward winning variants. This seems helpful but actually corrupts standard testing math. The platform's optimization creates a feedback loop where early random variations get amplified, making it harder to reach statistical significance.
The adjustment: increase Facebook sample requirements by roughly 40% compared to platforms without automatic optimization. If Google Ads needs 500 conversions per variant, Facebook needs 700 for equivalent confidence.
LinkedIn's audience sizes create the opposite problem. B2B targeting often yields audiences under 50,000 people. Traditional sample sizing assumes infinite populations. The finite population correction becomes mandatory:
Adjusted sample = standard sample × √((population - standard sample)/(population - 1))
For a 10,000 person LinkedIn audience, this can reduce required samples by 30-40%. Ignoring this correction means waiting for impossible sample sizes.
TikTok introduces temporal complexity. Creative performance degrades rapidly, often within 48-72 hours. Standard tests assuming stable performance across weeks don't work. Instead, TikTok tests need compressed timelines with higher daily sample targets. Better to test three variants for three days than five variants for two weeks.
Building creative testing velocity without burning budgets
The sustainable testing cadence for most agencies is one to two conclusive tests monthly per client. Not fifteen half-powered tests. Not one perfect test. One to two tests that actually reach significance and produce actionable insights.
This constraint forces operational discipline. Monthly testing calendars become essential. Not aspirational "we should test this" lists, but committed allocations of specific budgets to specific tests with specific sample size targets.
The calendar template that maintains velocity:
-
Week 1-2 Test design and sample sizing - Lock test hypothesis - Calculate required samples - Confirm budget allocation - Brief creative with constraints
-
Week 2-3 Test execution - Launch with day-one QA - Daily sample accumulation tracking - No early peaking at results
-
Week 4 Analysis and documentation - Statistical significance check - Confidence interval calculation - Pattern documentation - Next test planning
This rhythm means always having one test in design, one in field, and one in analysis. Testing becomes operational habit, not sporadic initiative.
The velocity killer agencies must avoid: test extension addiction. A test doesn't reach significance in two weeks, so you extend it. Then extend again. Soon you're in week six of a test that's morphed three times and proves nothing. Better to call an underpowered test failed and move on than drag it out hoping for clarity that won't come.
Software automation in the testing workflow
The operational burden of manual test tracking breaks most agency testing programs. Not the math complexity, but the sheer grind of daily sample tracking, significance calculations, and dashboard updates.
AI-powered operational software transforms testing from theoretical best practice to sustainable operation. Not by replacing human judgment, but by automating the repetitive calculations and tracking that exhaust team capacity.
The automation sweet spots in testing workflows:
-
Daily sample size tracking pulls from ad platforms automatically. Instead of manually checking whether you've hit 400 conversions per variant, the system alerts you when you're 80% there. This prevents both premature test conclusions and expensive test overruns.
-
Confidence interval calculations update in real-time as data accumulates. No more Excel spreadsheets with questionable formulas. The system shows exact confidence ranges based on actual sample sizes, preventing the false precision that misleads clients.
-
Test documentation generates automatically from results. Winners, confidence levels, and context get captured without requiring post-test reporting marathons. This builds the institutional knowledge base without additional effort.
-
Budget pacing adjusts based on sample accumulation rates. If a test needs 500 more conversions and you're collecting 50 daily, the system calculates exactly how much budget remains needed. This prevents both underspending that delays results and overspending after significance is reached.
Set alerts at 80% of required samples to avoid premature conclusions or costly overruns.
The transformation isn't about sophisticated AI making creative decisions. It's about operational software handling the mundane tracking that makes rigorous testing sustainable at agency scale. When sample sizing becomes automatic, when confidence intervals calculate themselves, when documentation happens by default, testing transforms from burden to competitive advantage.
The testing constraints that actually matter
Agencies don't fail at testing because they lack creativity or statistical knowledge. They fail because they ignore operational constraints until it's too late to adjust.
Budget constraints, timeline constraints, sample size constraints, platform constraints — these aren't obstacles to work around. They're the parameters that should shape test design from conception. When you start with constraints and work backward to creative, you run fewer tests that produce more actionable insights.
This framework isn't about perfect testing. It's about sustainable testing that acknowledges agency realities. Small budgets. Tight timelines. Impatient clients. Multiple platforms. These constraints don't disappear because we wish they would. But they become manageable when we build workflows that account for them from the start.
The agencies consistently winning with creative testing share one trait: they treat testing as an operational discipline, not a creative exercise. They calculate sample sizes before briefing creative. They document patterns systematically. They automate the repetitive tracking that burns team capacity.
Most importantly, they've accepted that better operational discipline beats perfect creative inspiration. A mediocre creative variant tested properly beats brilliant creative tested badly. Every single time.
The templates, formulas, and frameworks here aren't theoretical ideals. They're practical tools born from watching hundreds of agencies struggle with testing reality.
Ready to elevate your agency's performance?
Join 2,000+ agencies using Digmaly to save time, boost efficiency, and deliver superior client results.